Indian Community • United States
Which Indian Communities Live Where in America
3,017,057 speakers of India’s six largest diaspora languages • Six different capitals • Every figure from the 2024 Census
There is no single map of Indian America. There are at least six, laid on top of each other, and they do not match. The Bengali map centers on New York so heavily that one metro holds a third of the country’s Bengali speakers. The Telugu map centers on Dallas. The Gujarati map on New Jersey. The Punjabi map runs through California’s Central Valley, through towns most tech-corridor Indians have never visited. This page puts all six maps side by side — 13 metros, six languages, every number from the U.S. Census Bureau — so you can see at a glance where your community actually is.
Last updated: August 2026 • All Indian community guides →
The Short Answer
Each of the six largest Indian language communities has a different capital:
- Bengali → New York City. 144,474 speakers — 34% of all Bengali speakers in the country, more than the other twelve metros on this page combined.
- Telugu → Dallas-Fort Worth. 51,444 speakers. The Bay Area is next at 46,628. The gap of 4,816 is larger than the margin of error of the difference (about 4,200), so the two estimates are statistically different at 90% confidence.
- Gujarati → New Jersey. 83,883 speakers — 18% of Gujarati America — nearly double second-place Chicago.
- Tamil → Bay Area. 44,169 speakers, well clear of New Jersey’s 27,905.
- Punjabi → Bay Area among large metros, at 41,299 — but the single densest Punjabi place in America is Yuba City, a Central Valley farming town, and that story is told below.
- Hindi → Bay Area. 122,462 speakers, ahead of New Jersey’s 94,063 — though Hindi is the one language that is genuinely everywhere.
Measured across all six languages together, New Jersey and the Bay Area are effectively tied as the largest Indian-language metros, at roughly 295,000 and 291,000 speakers. New York City is third at about 255,000 — but its mix is unlike anywhere else, dominated by Bengali and Punjabi rather than the tech-driven Telugu, Tamil and Hindi that define the other large metros.
The Map: Thirteen Metros, Six Communities
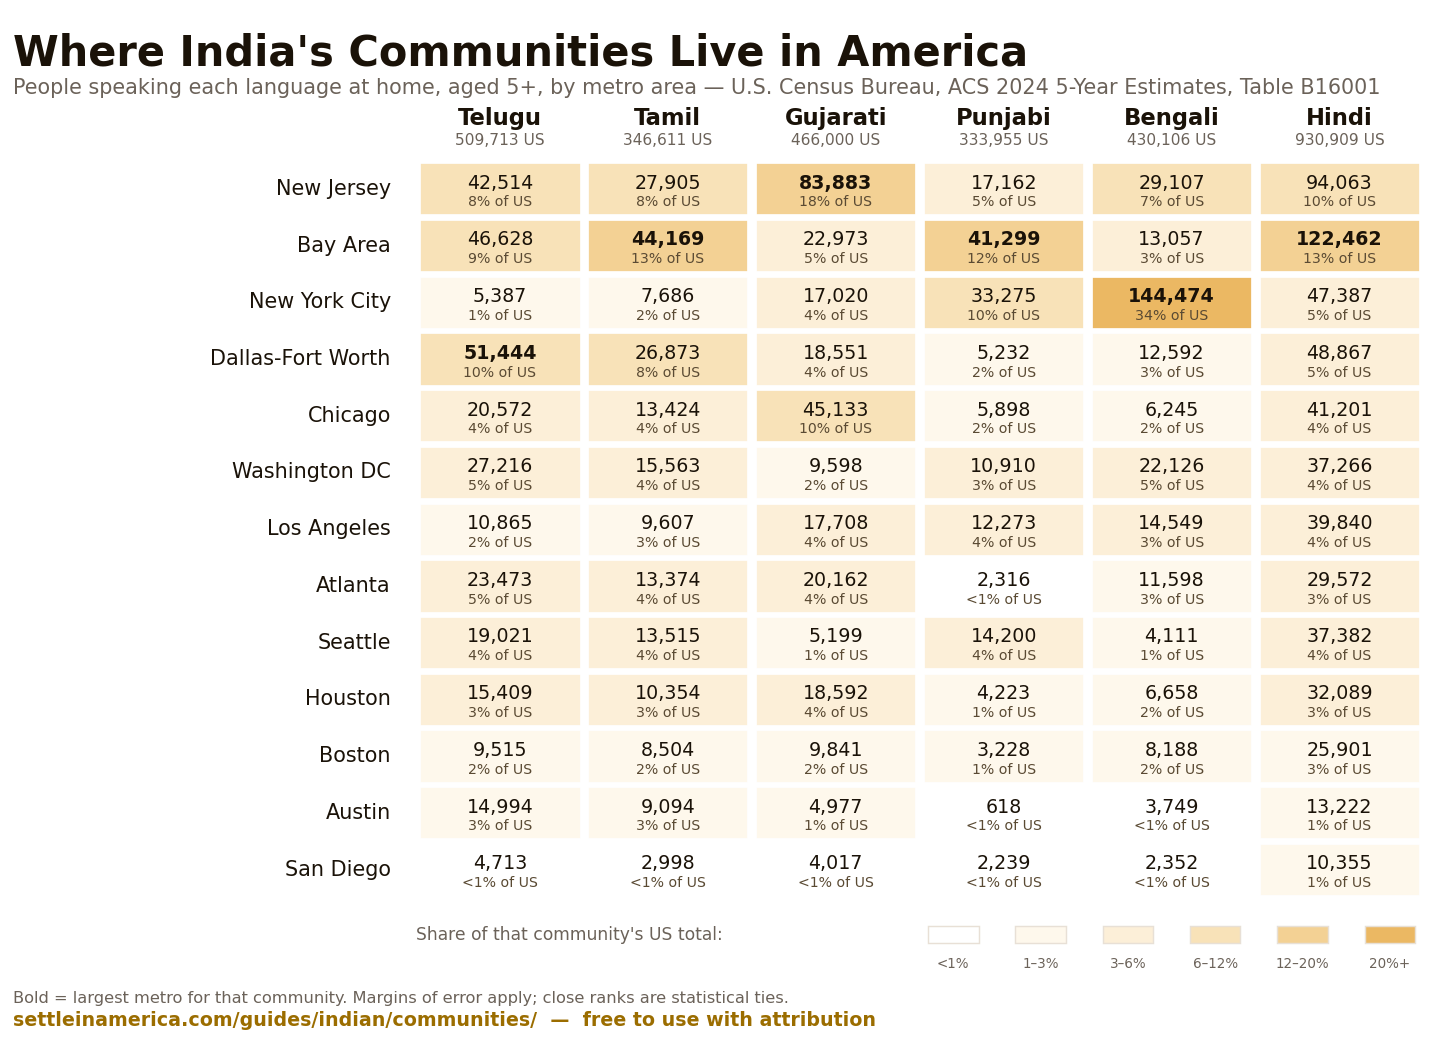
Each column is one language. Shading shows how concentrated that community is in that metro — the darker the cell, the larger the share of that community’s total US population living there. Read down a column to see where a community clusters; read across a row to see a metro’s mix. Every cell links back to a number of people aged five and over who speak the language at home.
| Metro | Telugu509,657 US | Tamil346,611 US | Gujarati466,000 US | Punjabi333,955 US | Bengali430,106 US | Hindi930,728 US |
|---|---|---|---|---|---|---|
| New Jersey | 42,5148% of US | 27,9058% of US | 83,88318% of US | 17,1625% of US | 29,1077% of US | 94,06310% of US |
| Bay Area | 46,6289% of US | 44,16913% of US | 22,9735% of US | 41,29912% of US | 13,0573% of US | 122,46213% of US |
| New York City | 5,3871% of US | 7,6862% of US | 17,0204% of US | 33,27510% of US | 144,47434% of US | 47,3875% of US |
| Dallas-Fort Worth | 51,44410% of US | 26,8738% of US | 18,5514% of US | 5,2322% of US | 12,5923% of US | 48,8675% of US |
| Chicago | 20,5724% of US | 13,4244% of US | 45,13310% of US | 5,8982% of US | 6,2452% of US | 41,2014% of US |
| Washington DC | 27,2165% of US | 15,5634% of US | 9,5982% of US | 10,9103% of US | 22,1265% of US | 37,2664% of US |
| Los Angeles | 10,8652% of US | 9,6073% of US | 17,7084% of US | 12,2734% of US | 14,5493% of US | 39,8404% of US |
| Atlanta | 23,4735% of US | 13,3744% of US | 20,1624% of US | 2,316†<1% of US | 11,5983% of US | 29,5723% of US |
| Seattle | 19,0214% of US | 13,5154% of US | 5,1991% of US | 14,2004% of US | 4,1111% of US | 37,3824% of US |
| Houston | 15,4093% of US | 10,3543% of US | 18,5924% of US | 4,2231% of US | 6,6582% of US | 32,0893% of US |
| Boston | 9,5152% of US | 8,5042% of US | 9,8412% of US | 3,228†1% of US | 8,1882% of US | 25,9013% of US |
| Austin | 14,9943% of US | 9,0943% of US | 4,9771% of US | 618†<1% of US | 3,749†<1% of US | 13,2221% of US |
| San Diego | 4,713<1% of US | 2,998<1% of US | 4,017†<1% of US | 2,239†<1% of US | 2,352<1% of US | 10,3551% of US |
Bold marks the largest metro for that community. A dagger (†) marks estimates whose margin of error exceeds a quarter of the estimate — treat those as rough. Every figure carries a margin of error at 90% confidence; where two metros are close, the honest reading is a tie. We aggregated these metro totals ourselves from Public Use Microdata Area data with metro boundaries corrected in August 2026, so figures here may run slightly higher than the same statistic on an older city page pending its update.
How we define each metro
Metro boundaries are a real source of confusion when comparing population figures, so here are ours in full. These are county-based definitions, not the Census Bureau’s Combined Statistical Areas (CSAs). A CSA is deliberately wider — the Bay Area CSA reaches to Santa Cruz and Stockton, and the New York CSA absorbs northern New Jersey — so a figure labelled “Bay Area” or “New York” elsewhere may be substantially larger than ours without either being wrong. If you are comparing our numbers with another source, check the geography first.
| Metro | Counties included |
|---|---|
| New Jersey | Entire state (all 21 counties). Our New Jersey and New York City figures are separate and never overlap. |
| Bay Area | Alameda, Contra Costa, Marin, Napa, San Francisco, San Mateo, Santa Clara, Solano, Sonoma (CA) |
| New York City | The five boroughs plus Nassau, Suffolk, Westchester and Rockland (NY). Excludes New Jersey, which we report separately. |
| Dallas-Fort Worth | Collin, Dallas, Denton, Ellis, Johnson, Kaufman, Parker, Rockwall, Tarrant (TX) |
| Chicago | Cook, DuPage, Kane, Kendall, Lake, McHenry, Will (IL). Excludes the Indiana and Wisconsin portions of the CSA. |
| Washington DC | District of Columbia; Alexandria, Arlington, Fairfax, Fauquier, Loudoun, Prince William, Stafford (VA); Charles, Frederick, Montgomery, Prince George’s (MD) |
| Los Angeles | Los Angeles, Orange (CA). Excludes Riverside and San Bernardino. |
| Atlanta | Barrow, Cherokee, Clayton, Cobb, Coweta, DeKalb, Douglas, Fayette, Forsyth, Fulton, Gwinnett, Henry, Newton, Paulding, Rockdale, Walton (GA) |
| Seattle | King, Pierce, Snohomish (WA) |
| Houston | Brazoria, Chambers, Fort Bend, Galveston, Harris, Liberty, Montgomery, Waller (TX) |
| Boston | Essex, Middlesex, Norfolk, Plymouth, Suffolk (MA). Excludes the New Hampshire portion of the CSA. |
| Austin | Bastrop, Caldwell, Hays, Travis, Williamson (TX) |
| San Diego | San Diego County (CA) |
One known limitation: 2020-vintage Public Use Microdata Areas do not always nest inside county lines. Where a PUMA spans a metro-edge county and an outside county, it is counted in full, which slightly overstates the edges of some metros. The dense cores — Frisco, Fremont, Edison, Ashburn, Jackson Heights — are unaffected.
What these numbers are, and what they are not
This counts people who speak the language at home, which is the only way the Census measures these communities separately. It undercounts everyone: children under five are excluded, and second-generation Indian Americans who grew up answering in English are invisible to it. The real communities are meaningfully larger. Treat the numbers as a consistent way to compare metros, not as headcounts.
Language also does not equal nationality. Bengali counts include the large Bangladeshi-American community — especially in New York — and Punjabi counts include Punjabi speakers of Pakistani origin. We note where that matters on the individual community pages.
Use this data — free with attribution
Everything on this page — the table, the graphic, the underlying figures — is free to reuse under CC BY 4.0: use it in articles, newsletters, community sites or research, with a link back to this page as the source.
- Download the full dataset (CSV) — all 13 metros × 6 communities, with estimates, 90% margins of error and US shares.
- Embed the graphic. Copy the snippet below and the attribution travels with it.
<a href="https://settleinamerica.com/guides/indian/communities/">
  <img src="https://settleinamerica.com/wp-content/uploads/2026/08/indian-communities-heatmap-acs2024.png"
       alt="Where Indian communities live in America: metro heatmap (ACS 2024)" width="1200" />
</a>
<p>Data: <a href="https://settleinamerica.com/guides/indian/communities/">Settle In America</a>, ACS 2024</p>
Cite this page: Settle In America, “Which Indian Communities Live Where in America,” analysis of U.S. Census Bureau American Community Survey 2024 5-Year Estimates, Table B16001. https://settleinamerica.com/guides/indian/communities/
Each Metro Has a Personality
The table rewards reading closely, because almost no metro is “generically Indian.” Most lean hard toward particular communities, and the lean shapes everything — which temples get built, which festivals fill a fairground, which language you overhear at the grocery store.
The specialist metros
New York is the Bengali capital, and it is not close. 144,474 Bengali speakers is more than the other twelve metros combined, and it makes New York the only metro where Bengali is the largest Indian language. New York is also the number-two Punjabi metro at 33,275. What New York conspicuously lacks is the South Indian tech migration: fewer Telugu speakers than Austin, a metro one-twentieth its size.
Dallas-Fort Worth and Austin are the two metros where Telugu is number one. DFW’s 51,444 Telugu speakers are the community’s largest concentration anywhere in America, and in Austin, Telugu edges out even Hindi — the only two places on the map where that happens. The Telugu page tells that story in full.
Chicago is the only metro where Gujarati leads. 45,133 Gujarati speakers narrowly outnumber Hindi’s 41,201 — no other metro comes close to that pattern. Devon Avenue’s history and the Gujarati business corridor are covered in our Chicago guides.
New Jersey is Gujarati’s true home — 18% of all Gujarati speakers in the country, anchored by Oak Tree Road — even though Hindi is technically the state’s largest Indian language. It is also quietly the number-two metro for Telugu, Tamil and Bengali. Nothing about Indian New Jersey is small.
The balanced metros
The Bay Area is first or second in four of the six languages — first for Tamil, Punjabi and Hindi, second for Telugu — the only metro with that range. Washington DC and Atlanta run Telugu-leaning but broad. Seattle has one distinctive trait: Punjabi speakers outnumber Gujarati speakers nearly three to one, an inversion of most tech metros. Houston leans Gujarati and Hindi; Los Angeles is the most evenly spread of the big metros, with no community holding even 5% of its national total.
Boston and San Diego round out the table — real communities in both, with Hindi the largest in each. We have not yet built city guides for them, and the numbers are on the map so you can weigh them anyway.
What the Map Cannot Show
Nine communities the Census cannot count separately
Table B16001 gives Telugu, Tamil, Gujarati, Punjabi, Bengali and Hindi their own lines. It does not do that for every community. Malayalam and Kannada are merged into a single “other Dravidian” bucket; Marathi is lumped with Nepali; Sindhi, Odia and Konkani have no line at all — and Jain identity is religious, not linguistic, so no language table can capture it. Those communities are absolutely mappable by other evidence — churches, temples, associations, festivals — and we map them that way on their national pages: Malayali, Kannada, Marathi, Sindhi, Jain, Goan, Odia, Bihari and Rajasthani.
Punjabi America mostly is not on this map
Only 46% of Punjabi speakers live in these thirteen metros — the lowest share of any community here, against 57–65% for the others. The reason is history: a century of Punjabi Sikh farming communities in California’s Central Valley. The Yuba City area alone has 10,103 Punjabi speakers — the single largest Punjabi concentration in the nation, bigger than any one district of the Bay Area or Queens. Bakersfield, Stockton, Tracy, Fresno and Sacramento all hold thousands more. A map of big metros structurally misses the heart of Punjabi America, which is why our Punjabi & Sikh page treats the Central Valley as a first-class destination.
Bengali America beyond New York
Metro Detroit — the Hamtramck-Warren corridor — and Buffalo each hold Bengali communities in the several thousands (roughly 9,100 in the Warren area and 8,400 in East Buffalo by the same Census measure), largely Bangladeshi-American, and neither appears in the table above. Both are among the most affordable substantial Bengali communities in the country.
Urdu
Urdu has 533,546 speakers in the US — more than Tamil or Punjabi — and we deliberately left it off this map: Urdu-speaking America is substantially Pakistani-American, and folding it into an “Indian communities” table would misdescribe both. Where Urdu and Hindi speakers share institutions, our Hindi-speaking pages say so.
Common Questions
Which US metro has the largest Indian community overall?
Across the six largest Indian languages combined, New Jersey (about 295,000 speakers) and the Bay Area (about 291,000) are effectively tied — the gap is smaller than the margin of error. They get there differently: New Jersey through Gujarati depth plus strength in everything else, the Bay Area through Hindi, Tamil, Telugu and Punjabi.
Which Indian language has the most speakers in America?
Hindi, at 930,728 — though Hindi is a lingua franca as well as a mother tongue, so it overlaps many communities of origin. The largest single regional-language community is Telugu at 509,657, followed by Gujarati at 466,000.
Where do most Bengali speakers in America live?
New York City, overwhelmingly: 144,474 speakers, about 34% of the national total and more than the next twelve metros combined. New Jersey is a distant second at about 29,100. The figure includes the city’s large Bangladeshi-American community, which shares the language.
Where is the largest Telugu community?
Dallas-Fort Worth, at 51,444 speakers, ahead of the Bay Area at 46,628. The gap of 4,816 is larger than the margin of error of the difference (about 4,200), so the Census test calls them different at 90% confidence. The lead is real and narrow.
Why are Malayali, Kannada and Marathi missing from the table?
The Census merged them into combined buckets in 2016 — Malayalam and Kannada into “other Dravidian languages,” Marathi in with Nepali — so no clean number exists for those communities. Their national pages map them using community infrastructure instead: churches, temples, associations and festivals.
Do these numbers count everyone of Indian origin?
No. They count people aged five and over who speak the language at home. Children under five and English-dominant second-generation families are not counted, so every community is larger than its number here. Separately, the Census counts about 4.6 million people reporting Asian Indian race alone — half again the six-language total.
Every Community, Coast to Coast
Each national page maps one community across every major metro — where it concentrates, which cities fit which situations, and the organizations that hold it together — and links to the detailed city guides.
- Telugu across America — 509,657 speakers; Dallas-Fort Worth and the Bay Area lead
- Gujarati across America — 466,000 speakers; New Jersey is the capital
- Hindi-speaking communities — 930,728 speakers, in every metro on the map
- Bengali across America — 430,106 speakers; New York dominates
- Tamil across America — 346,611 speakers; the Bay Area leads
- Punjabi & Sikh across America — 333,955 speakers, from Fremont to Yuba City
- Malayali across America — mapped through churches, associations and healthcare networks
- Kannada across America — the Bangalore tech pipeline’s American footprint
- Marathi across America — Mandal networks across the major metros
- Jain communities in America — mapped by derasar and sangh
- Sindhi across America — a diaspora within a diaspora
- Bihari communities — the newest major migration wave
- Goan communities — parish networks and old trade routes
- Odia communities — small, concentrated, highly organized
- Rajasthani & Marwari communities — business networks first
Data Sources
Population figures: U.S. Census Bureau, American Community Survey 2024 5-Year Estimates, Table B16001 (Language Spoken at Home), variables B16001_045 (Gujarati), _048 (Hindi), _051 (Urdu), _054 (Punjabi), _057 (Bengali), _066 (Telugu), _069 (Tamil). Metro totals aggregated from Public Use Microdata Area data by constituent county and city, because the ACS does not publish detailed language tables at metropolitan level; metro boundary definitions corrected August 2026 to include city-named PUMAs. Margins of error combined using the Census Bureau’s published method for aggregated estimates, at 90% confidence. Asian Indian race figure: ACS 2024 5-Year, Table B02015. Read our full research methodology →